A summary of Czarnikow’s presentation at Kingsman’s 5th Delhi Sugar Conference in 2011
The outlook for the global sugar economy does not look good. From what I have heard so far at this conference the Indian sugar industry is in a bad place financially. But it’s not alone. The global sugar economy seems to be in a pretty bad place: It seems as though almost everyone is losing money.
“The global sugar economy seems to be in a pretty bad place: It seems as though almost everyone is losing money…”
Just this week I read that the South African sugar industry is worried as it believes that it is losing around 50 million Rand every month as a result of imports from the world market undercutting domestic prices. The South African industry values these imports below the cost of production yet it too is exporting at world market prices, which shows the environment that we are in.
And looking at the bigger picture it seems as though we are living in a pretty confusing world today. What’s happening to the Dollar. What does Tapering actually mean in real life. And why does it seem to have affected the emerging economies in advance?
I am a guest in India today but I am sure that everyone living here is very worried about the macro economic outlook and what it means. I was pretty surprised when a couple of weeks ago I read that the India government was actually considering closing filling stations in the evening to reduce demand for fuel. While this seems a strange approach it shows that when things get over done people start coming up with strange solutions.
Despite the bad news the global economy keeps on growing. The Indian economy will grow at something around 5% this year and as we have continued to see it is the developing economies that are driving the global economy. However, it seems a bit odd to class China as a developing economy, so lets use the term “fast growing economies”. What we can see is that it is the developed world that seems to be dragging its heels when it comes to economic growth and trade. But it’s everywhere else that is still doing ok.
The global economy
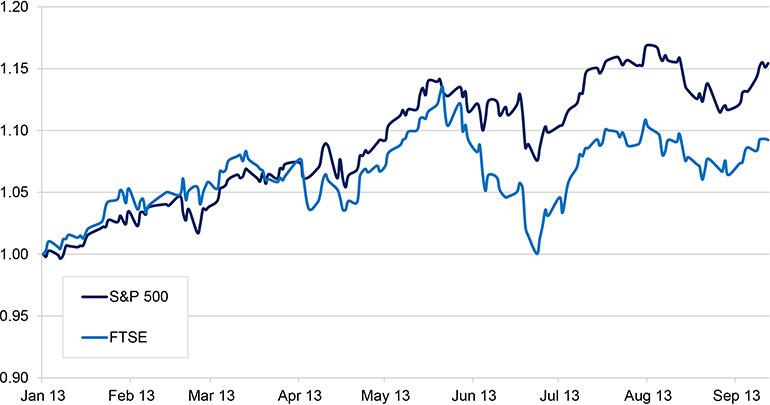
So here’s something else that looks odd. Why is the S&P 500 up 15% this year on expected economic growth of around 2% in the US or the FTSE up 10% when the UK is struggling to get to 1% growth. Well, the answer is that after years of staying away from equities the market is underinvested and what we are seeing is a bit of catch up.
I think that’s an interesting place to start thinking about the sugar outlook because it seems to me as though the price of sugar has got down to a level that producers can’t live with and even though there are some people who hope it well get cheaper still is there a risk, just like the S&P, that buyers are under-committed?
But what’s very different about the sugar market is the growth story.
Annual Increase in Global Dry Bulk Trade
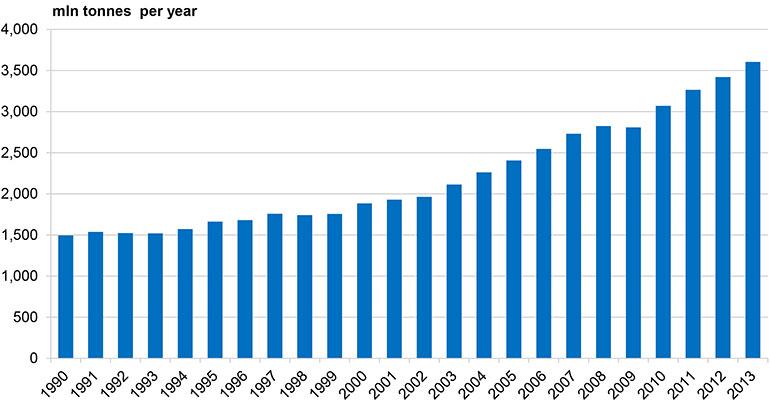
This chart shows global growth in the dry bulk market. Growth is estimated at around 3 to 5%. Global trade continues to grow. Sugar is a small part of this growth but that does not mean it’s not interesting.
Global Raw Sugar Trade
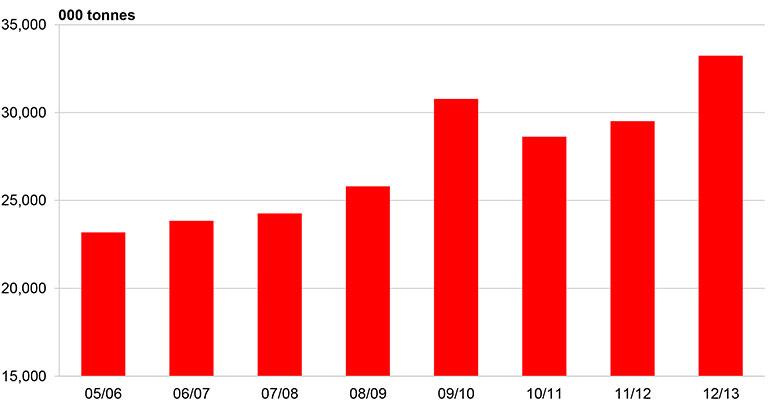
We have been looking at growth in trade all year and while we had expected to see it slow down it hasn’t. It has continued to surprise us and as this chart of global raw sugar trade at world prices shows, total trade is up almost 4m tonnes or over 10%. There is a similar trend in white sugar as well.
Now this is the debate. How much of that growth is purely inventory (as a lot of statistical balance sheets seem to indicate) and how much of it has actually been eaten? This is a very difficult question to answer. However, as the sugar has gone into commercial hands and it has not made a lot of commercial sense to put it into a warehouse and carry it it would seem as though a lot is being consumed.China is a bit of an exception here as the government has bought up some domestic sugar for stock but there is also strong growth in the consumer market as well. In fact we don’t have to look far to find some very clear examples of strong consumer led import growth. Indonesia is a good example of local consumption growth being behind refinery demand for raw sugar. And there are plenty of other examples of this happening stretching across to the Middle East and North Africa.
Change in Stock (Production vs. Consumption)
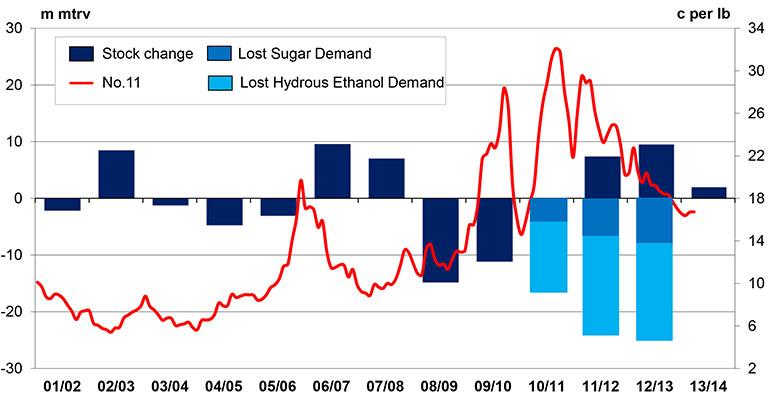
When we build our statistics we like to learn from what we are seeing in physical and domestic markets and take this across to the balance sheet. As a result we now have a much tighter set of numbers this year. We released our revised figures a couple of weeks back which point to a surplus of just 2m vs our earlier 3.9m tonnes. But I suspect we are still being too conservative with consumption as the problem is it is very hard to spot growth in advance.
The real question is why is this growth coming through? Well we think it is because the market is playing catch-up. Earlier in the year we made an analysis of the foregone demand: Demand that had been destroyed by the GFC, high sugar prices and the events of the Arab Spring. What is interesting about this analysis is that it shows that the rise in stock during the two previous seasons was much lower than the lost demand in sugar and ethanol. This really shows the potential for the demand side of the market to absorb the surpluses that get all the attention.
Growth in Anhydrous Sales


“Affordability or income elasticity is the dynamic that has delivered growth over the years. And this is where we have been surprised today”
I read a comment in one of Jonathan Kingsman’s reports recently in which he mentioned a discussion around this point. The argument went that it would have been somehow better if the hydrous market had performed as everyone had hoped and absorb the growth in Brazilian ATR when prices became competitive with gasoline. But unfortunately the price elasticity in hydrous ethanol consumption that we have seen so far has not been as strong as we expected suggesting that the disincentive (as ethanol prices out) is greater than the incentive to return to ethanol usage (as it prices in). Usage of both hydrous and anhydrous ethanol are both stronger though.
We had never thought that the sugar market would perform in the same way as the studies that we have conducted into long run trends in sugar consumption have all concluded that the key relationship has been with income rather than price. Affordability or income elasticity is the dynamic that has delivered growth over the years. And this is where we have been surprised today.
Global Sugar Consumption
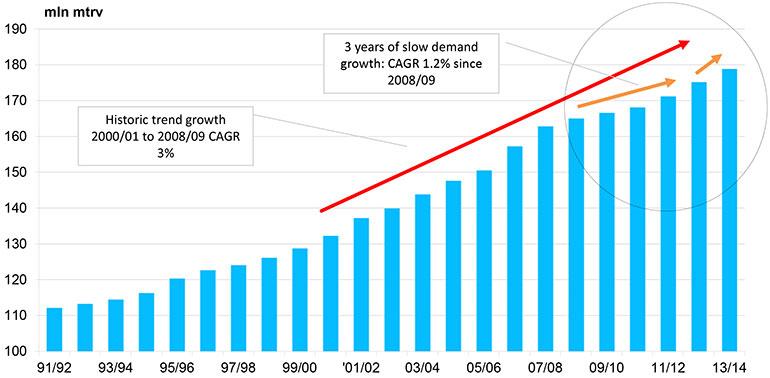
This slide shows our view of consumption. In the past decade sugar went through a fast growth phase but this slowed due to the GFC, high sugar prices and the events of the Arab Spring. Now we believe that the market is getting back to that faster growth phase, based on what we can observe. However, trying to spot the growth is a challenge and in aggregate our number for consumption growth is up 2.3% y-o-y, which is of course below the 3% run-rate of the previous decade.
Sugar Price / Consumption
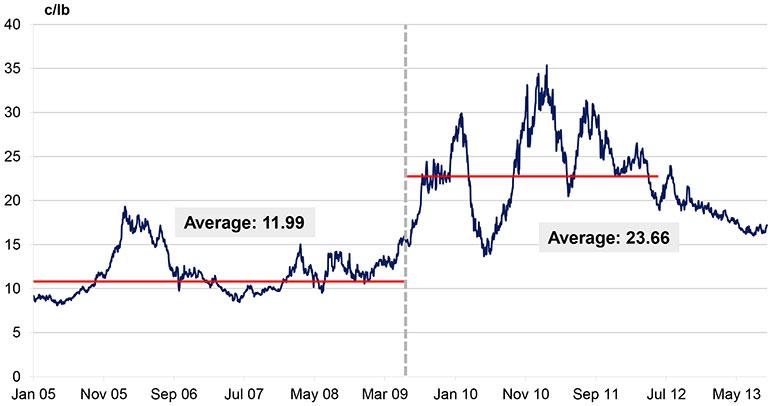
So why is consumption bouncing back? Well to start with affordability is returning. Looked at on a No.11 basis, prices don’t look cheap but after having doubled on average between the fast growth phase and the slow growth phase they are getting back to being reasonable. But a better way to think about this is to look at the whites market…
Sugar Prices Back to $500 / tonne
“We always thought that 2013 would be a good year for consumers in sugar and it seems that they have certainly responded!”
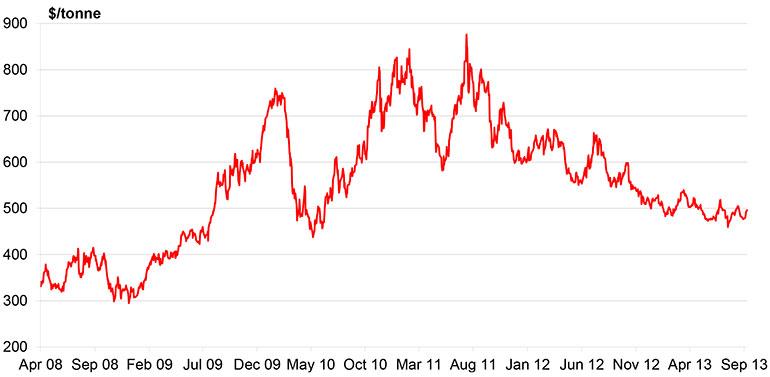
This slide shows white sugar futures prices back to $500. And whats impressive is how they have stuck there. $500 seems to have been a bit of a magic number for the consumer and as a result, as whites have stayed steady and raw sugar prices have fallen, we have seen a rise in the white sugar premium this year. We always thought that 2013 would be a good year for consumers in sugar and it seems that they have certainly responded!
So its probably time to take a step back and think about what shapes that demand.
The population is growing and the world is becoming more crowded. At the same time sugar consumption, which is averaging around 23 kg a head, is still below the developed economy average. That means that there are ever more people out who want to consume more sugar.
All those people all have budgets and especially in fast growing low income economies there are constraints on affordability, which affect everything – not just sugar.
For lots of these households the biggest spend is on food, which means it’s important to consider purchasing power.
FAO Food and Sugar Price Indices
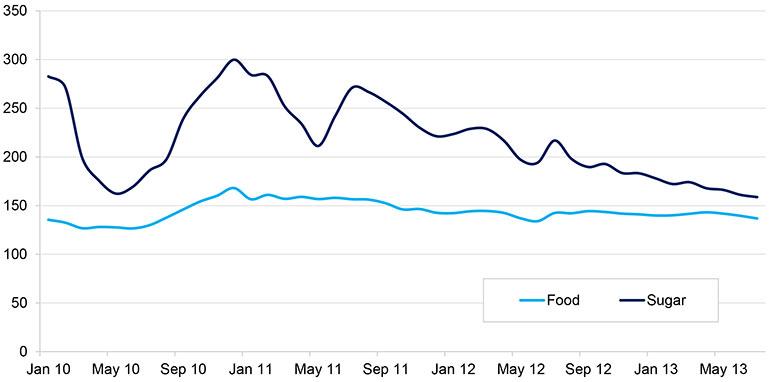
We can think about this by looking at the whole basket of foods bought by consumers and how that has changed. To enable us to consider this we have taken the FAO’s food price index and sugar price index. (Food & Agriculture Organisation of the United Nations). The the food price index falls gently – down 20% from the highs of October 2010, which therefore stretches the spending power consumers. However, within this basket the sugar price index is down 50%. Food is not only more affordable but sugar’s become cheap.
Now that’s good for consumers but not for producers.
Global Sugar Production
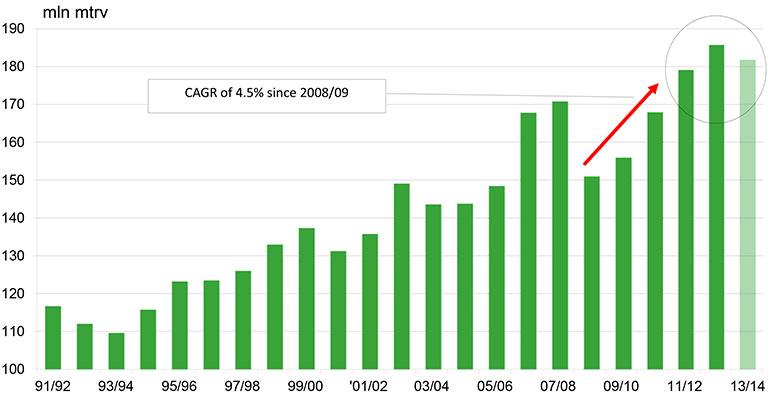
As I said at the start of the presentation all I read is bad news. Listed producers continue to report losses and write downs. Smaller mills close down. We can already start to see this in the production balance as production is falling. Beet sugar production is now down for the third year in a row and while sugar cane is slower to react due to the longer crop cycle, the full story is not yet coming through as we can be sure that cane industries are cutting back on opex in order to conserve cash flow.
“The market is setting itself up to be very vulnerable to a weather event”
That suggests to me – just as we have seen before when the sector is financially stressed – that the market is setting itself up to be very vulnerable to a weather event.
However, there’s also another issue to consider. If the balance sheet is now much closer to equilibrium and the downside pressures have reduced to the extent that the risk reward of being short has gone. Then what is a fair price for sugar?
Our view is that the current price is one that does not pay the bills. Some producers can’t even cover their operating costs. Though others can cover these costs what this all means is that fixed expenses, taxes, finance changes get added to debt. Now you can only get away with paying only operating costs in the short run as in the long run equity values are diminished and debt levels rise.
During this conference I have heard a lot about the problems that lenders face taking producer risk and the problems that producers face getting lenders to take them on. It sounds to me as though a lot of people have already moved beyond the short run.
So what’s the price of that solution?
ROE vs No.11
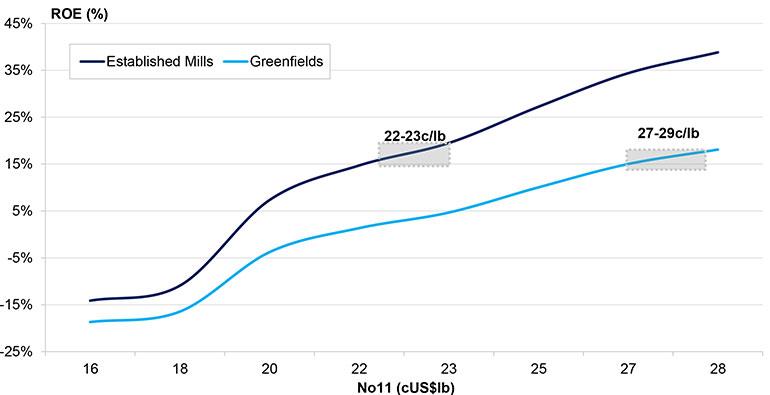
Well the answer obviously varies from business to business but the more we have looked at this the more it has seemed that a sustainable price for sugar, for a balanced sugar market, is somewhere north of 20c. This chart here is based on a range of calculations we have made for a theoretical Brazilian mill carrying 80% debt to equity. It makes surprising reading as it shows that we need to see prices around 22 / 23 c/lb in order to generate a decent return to investors. Now you might think that 15% looks quite high but as the risk free rate of return in Brazil is around 10% then this is not an unreasonable number.
Current prices are probably around 10c below the level needed to support new greenfield investment and instead are at a point that is forcing production to close down. This is why the outlook for the moment does not look good. But with consumption growing year on year and the balance sheet now moving back towards equilibrium there is no reason why this should be so.
